Setting Streamflow Level Lines
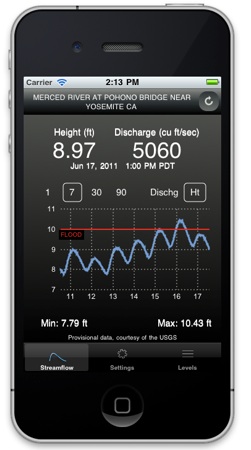
Level lines are labelled, horizontal lines, drawn on the chart at the height you specify.
Use them to show Flood Levels obtained from National Weather Service River Forecast centers. The California Nevada River Forecast Center is here:
Other regional centers are listed here:
http://water.weather.gov/ahps/rfc/rfc.php
To add a level line for the current station: Click Levels, then “Add Level” and set the line’s label, height, and color. This YouTube video shows how:
http://www.youtube.com/watch?v=_5trvWx0ll8
Flood level lines are saved and remembered between sessions. Level lines can be copied and pasted as iTunes shared files.