Minimum in Interval
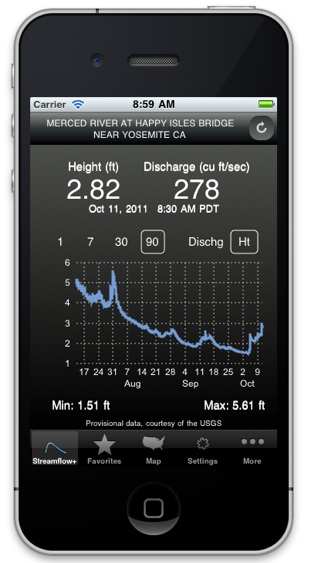
Returns to this View
Streamflow Plus displays real-time stream heights and flow data read from USGS river gaging sites. It shows current measurements and provides interactive charts plotting one, seven, 30 or 90 day chart views.
Streamflow Plus includes a database of USGS gaging sites, searchable by river name, site description, and site number. The search tool is incremental and updates as you type in search criteria.
Data from the sites you view are kept in a cache, which both reduces the load on USGS servers and makes for quick displays when you revisit sites.
Streamflow Plus runs on an iPod Touch, iPhone or iPad running iOS Version 4.0 or greater.
* Starred features are only available in the Plus version
Praise for Streamflow
Comments from users: “Love your app”, “looks terrific!”, “sharp”, “very nice application”, “Perfect” “pretty cool” “easy to use”
Thanks for all the hard work on the Streamflow app. I just upgraded from Streamflow to Streamflow Plus. It is my favorite of several now commercially available and I recommend it when asked.
Posted to the Silicon Valley iPhone Developers List: “What a great app.”
FIVE STAR App Store Reviews:
“I use this app all the time and may have to upgrade to the pay version so I can save favorites. Super convenient and helps me schedule my river water chemistry sampling according to current flow conditions.”
“This app is great. It’s exactly what I needed. It’s easy to use and simple to read with no unneeded clutter.”
“I had a couple small problems only on my iPhone. Tod Landis responded quickly. Works great.“
San Jose Mercury News:
http://www.mercurynews.com/ci_18089220
Santa Cruz Sentinel:
http://www.santacruzsentinel.com/ci_18093869
Discovery Channel’s TreeHugger blog:
http://www.treehugger.com/files/2011/05/streamflow-iphone-app-mobile-monitor-streams-rivers.php
Lonestar Bass:
http://lonestarbass.com/bass-fishing/pretty-cool-lakeriver-flow-app-for-iphone/?action=printpage
Wild for Fly Fishing:
http://www.wildforflyfishing.com/usgs-water-data-iphone-app.html
Panning and Zooming Charts
Hold your finger down on a chart and drag left or right to pan through time. As you pan,
watch the maximum and minimum values change.
Tap the 90 days button, then double tap on the chart to zoom in to a shorter time frame.
Notice that the new chart centers itself where you tapped. This also works on 7 or 30
day charts.
After zooming in, click a larger time frame to zoom back out. The new chart will retain
the old chart center.
Where does the data come from?
Streamflow displays provisional flow data from USGS Water Data sites. There is a wealth of information about them here: http://waterdata.usgs.gov/nwis/rt
Use the station number when you need to jump back and forth between Streamflow and the USGS or NWS web pages. (You can copy the number from the “Share” tab and set it from the “Settings” tab)
In the case of the San Lorenzo River “Big Trees” gaging station, which is near where I live, data is collected near the bridge for the Henry Cowell Redwoods. You can see its shed on the highway side of the bridge.
Be aware that the USGS attaches a warning to the data Streamflow downloads similar to this one:
The data you have obtained from this automated U.S. Geological Survey database have not received Director's approval and as such are provisional and subject to revision. The data are released on the condition that neither the USGS nor the United States Government may be held liable for any damages resulting from its use.
Additional info: http://waterdata.usgs.gov/nwis/help/?provisional
Antarctic Streamflow Sites
There are USGS gaging sites for streams in Antarctica. Seeing them using Streamflow requires a little effort. Go to Settings | Browse and open the state “Wyoming”. Start typing “antarctica” in the search box. You should then see two gaging sites for the Onyx River in Antarctica.
How to ...
How to set up level lines for the Merced River
How to find USGS gaging sites along a river
How to see where it is flooding
Have another question? comment? want to help?
Email questions and comments to: “streamflow [at] todlandis.com.” I am collecting ideas for version 1.4 now.
Reporting bugs
Please use the same email address to report bugs: “streamflow [at] todlandis.com.” Be sure to include what kind of device you are using, iPad, iPod, iPhone 4 and so on.
Known Problems
-
-“Quick Look” really is quick, and downloads begin as soon as you change settings. When you return to the Streamflow tab from the Settings tab it may have finished. This can be confusing at first, but, over time Streamflow users come to like it. After making a change, check the site description at the top of the Streamflow tab to see if you have the one you want.
Copyright (c) 2011 Tod Landis, All Rights Reserved

Discharge in Cubic Feet

Mode Selection Buttons

Interactive Chart
(Touch and drag pans.
Double tap zooms)

Height in Feet

Days Buttons

Site Description

Calendar labels

Time Zone


Refresh Button

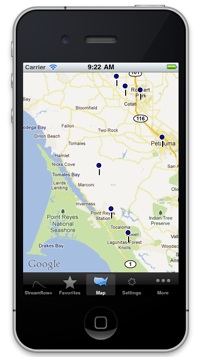
Maps *


Maximum in Interval
Favorites *

Change Settings

Email Screenshots! *
Set Flood Level Lines *
Streamflow Plus: An iPhone App for US Rivers